
It’s that time when you start thinking of your project. Here are some resources to help you along the way, but remember YOU NEED TO PLAN your project and not just launch in. I am sure there is a direct correlation between the amount of planning and the final mark. I’ve warned you! PLEASE NOTE there are other relevant posts for your project such as the Uncertainties work and individual help on some projects, but they are covered in separate posts.
| Title | Expt 1 | Expt 2 | Expt 3 | Expt 4 | Expt 5 | Expt 6 | Suitable | ||
|---|---|---|---|---|---|---|---|---|---|
| 1 | Charge to mass ratio | Electrical deflection | Magnetic Deflection | field compensation | |||||
| 2 | Determining Wavelength | Electron-Beam Diffraction | Laser Double-Slit Diffraction Experiment Newton’s Rings | Newton’s Rings | yes | ||||
| 3 | Focal length of mirrors and lenses | f of convex lens | f convex lens object and image distance | magnification of convex lens at conjugate points | f of concave lens | f of concave mirror | f of convex mirror | 4/6 appropriate level vary the equipment | |
| 4 | friction | (rotational ) frictional Torque | coefficient of static and kinetic friction and cross sectional area | Effect of angle of slope on static friction of block | |||||
| 5 | 'g' | simple pendulum | compound pendulum | mass on spring | the projects 5-7 should not be completed in groups less than 10. | ||||
| 6 | 'g' | simple pendulum | oscillating springs | balls on a concave mirror | |||||
| 7 | 'g' | Simple Pendulum | compound pendulum | katers pendulum | |||||
| 8 | 'g' | water stream | bifilar supension rod | balls on a concave mirror | |||||
| 9 | interference patterns to measure size of small obiects | Young's doubte slit | Air wedge | single slit inteference pallern | |||||
| 10 | LCR circuits | R of a resistor using the time conslant of different capacitors in an RC circuit. | cC of a capacilor in a series circuit was found by varying the frequency and measuring Xc. | frequency of an LCR circuit by varying the lrequency of an AC power supply and measuring the I. | |||||
| 11 | Lenses | Thin Lens Method: 1/f=1/do+1/di | Two Position Method: | Hollow lens (concentration on sugar on f and n) | yes | ||||
| 12 | Measuring v sound using resonance | Reasonance Tube | Kundt's Tube | Reuben Tube | |||||
| 13 | Moment of inertai disc hoop cylinder | I of disc | I of hoop | I of cylinder | Make sure some method are sophisticated and not all the same | ||||
| 14 | Moment of inertia | Cylinders on an Inclined Plane | Inertia of a Flywheel | Bifilar Suspension Rod | |||||
| 15 | Moment of inertia of rotating objects | The height beween the light gate and the centre of the axle of a flywheel was varied and the linear velocity of a falling mass through the litht gate was measured. | The mass hanging of{ a pulley on an air turntable was varied and the time for the air turntable to complete I0 revolutions was measured | The mass falling from the centre of a flywheel until it passes through two light gates was varied and the instantaneous velocities and times when the mass passed through was measured. | |||||
| 16 | Pendulums | Simple Pendulum | Bifilar Pendulum | Compound Pendulum | yes | ||||
| 17 | polarisation | Malus' Law | Brewster Angle (from turning point)- graph ought to be done. | Optical Activity of certain solutions | |||||
| 18 | Refractive index | sugar solution and hollow prism | Boys method for the radii of curvature of the surfaces of convex lens to find n | real and apparent depth | |||||
| 19 | Refractive Index (comparing methods) | Using a concave mirror | Travelling Microscope (real and apparent depth) | Wollaston Method | |||||
| 20 | SHM different constants | Simple Pendulum to find g | masses and springs (2 expts) to find k | double spring and trolley to find k | |||||
| 21 | Sound | velocity using resonance tube | frequency of a tuning fork using a sonometer | velocity of sound Kundt's Tube | |||||
| 22 | Speed of Light | Permeability og Free Space | Capacitance | Permittivity of Free Space | |||||
| 23 | Surface Tension of Water | Surface Tension of Water in a Capillary Tube | Surface Tension of a Soap Film | Drop Weight Method | Yes but you need graphs | ||||
| 24 | Surface Tension of Water | capillary tube | Direct Pull Method | Drop Weight Method | |||||
| 25 | Surface Tension of Water | Drop Weight Method | Direct Pull Method | Jaeger's Method | yes if graphically done, experimentally measure r water | ||||
| 26 | Varying f on R, L and C circuits | I and f in a capacitive circuit | I and f in an inductive circuit | I and f in a resistive circuit | variation of f in a parallel RLC circuit | variation of f in a series RLC circuit | Limited procedures! | ||
| 27 | Viscocity of water | Measuring density of water | Stokes' Law | Poiseuille Mathod | |||||
| 28 | Wavelength | Young's Slit | Newton Rings | Prism Spectrometer | |||||
| 29 | Waves in Strings | Resonant Frequency and Length | Resonant Frequency and Tension | Resonant Frequency and Tension Using Melde’s Experiment | |||||
| 30 | Young's Modulus | deflcction ofa steel bar acting as a loaded cantilevel | period of vibration of a copper bar acting as a loaded cantilever | extension ofa steel wire due to an applied load, | |||||
| 31 | Young's Modulus | Searle's Law |
A vital read BEFORE you start your project. This gives clear guidelines of the marking instructions and key details. Print off the relevant pages.
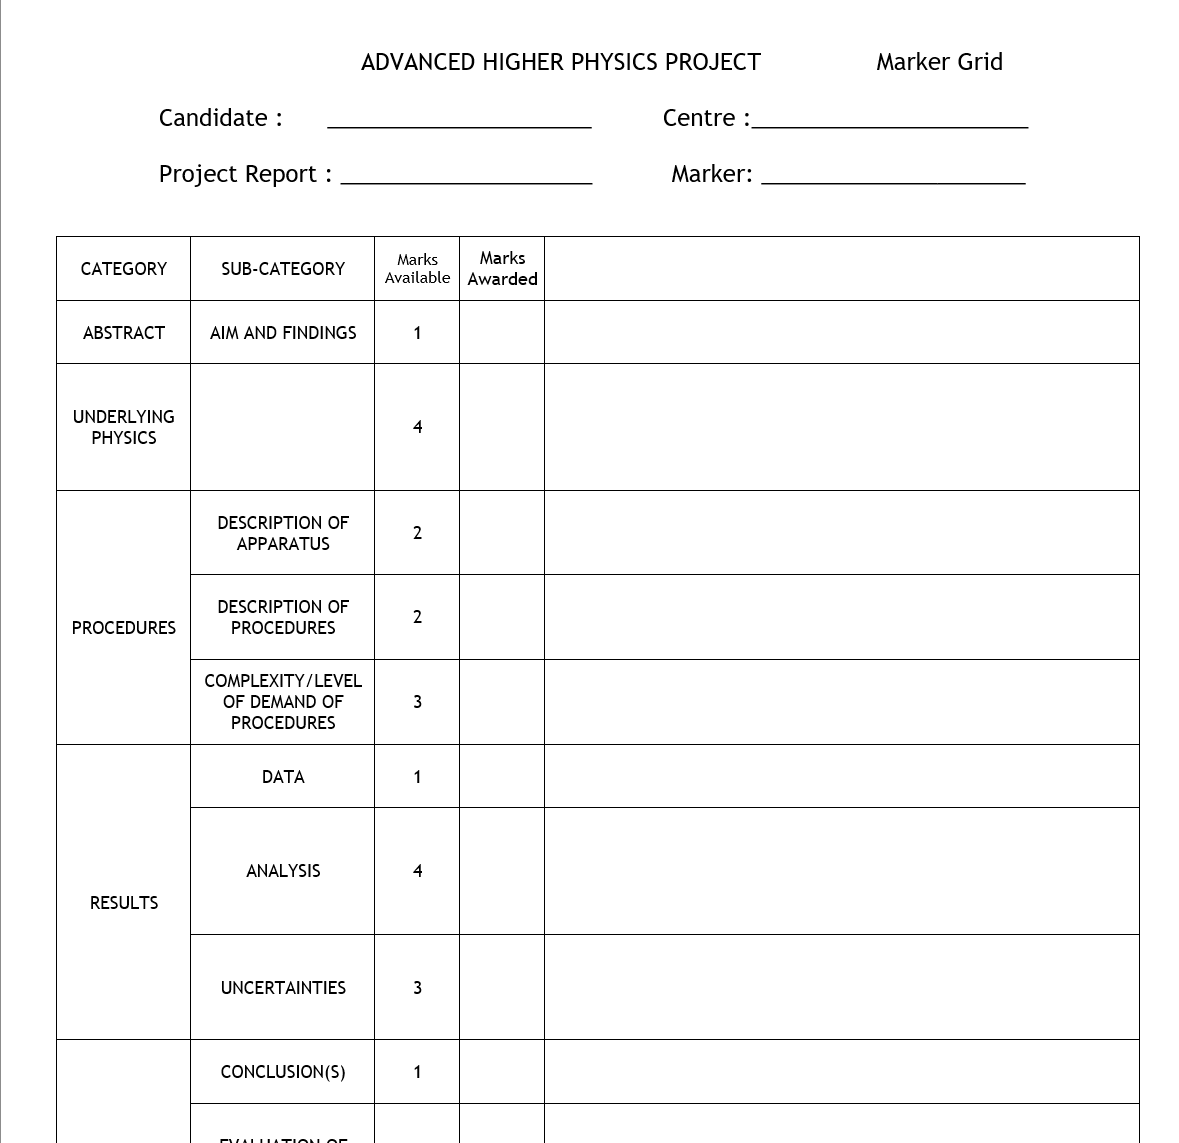
Project Marking Grid, for teachers and students. Keep it close as you work through your project.

A document currently being updated to give some ideas for project experiments. This is a little out of date, but gives some good ideas. An adaptation of Tom Balanowski’s notes by Mr Bailey. This is a useful guide to teachers preparing students for their AH Physics Project. PLANNING is the KEY.
A little document to give you some ideas about how to write up your project. Let WORD do the hard work for you.

Slides from a presentation I gave on Writing up AH Projects this is too large to upload, but if you contact me I might be able to grab you a link.
This video is suitable for all Sciences. It shows how word can be used to produce your project write-up structure if you follow these steps
Based on an S2 experiment but this is a great start to using excel if you’ve not been introduced to it before in Science. Notice we use quite different items than you might use in Business or Admin. sorry but you can no longer download Office through Glow so skip that bit and I’ll put editing it on my to do list.
Just a really quick unedited intro to putting in all those wonderful equations. Don’t forget cut and paste, and you can save your equations too.
If you sign up to Archive you can borrow a copy of Tyler, a great book to start with for project ideas, but the derivations are rubbish.

A guide to adding in all those additional columns and finding your LINEST. I’ll get a video done sometime.
This document (6772, helpful title eh!) was written for AH from 2000-2015, but it does contain some useful hints, tricks and examples. Caveat emptor!
If you sign up to Archive you can borrow a copy of Tyler, a great book to start with for project ideas, but the derivations are rubbish.
I will take down these files asap if anyone objects. I have tried very hard to find the owner of the copyright to these files. Please don’t fine me, I am trying to support Physics Education. This is the non-SI version, get an updated version if you can.
A scan of the Mechanics I Experiments from the 1959 Edition of Tyler. I’ve tried really hard to locate the Publishers of Tyler’s “A Laboratory Manual of Physics” to sort out copyright, but no one is owning up to this. Edward Arnold was taken over and is now part of the Hodder Education Group. I contacted them and they’ve no record of this book.
A scan of the Mechanics II Experiments from the 1959 Edition of Tyler. I’ve tried really hard to locate the Publishers of Tyler’s “A Laboratory Manual of Physics” to sort out copyright, but no one is owning up to this. Edward Arnold was taken over and is now part of the Hodder Education Group. I contacted them and they’ve no record of this book.
A scan of the ELECTRICITY Experiments from the 1959 Edition of Tyler. I’ve tried really hard to locate the Publishers of Tyler’s “A Laboratory Manual of Physics” to sort out copyright, but no one is owning up to this. Edward Arnold was taken over and is now part of the Hodder Education Group. I contacted them and they’ve no record of this book.
A scan of the ELECTRICITY II Experiments from the 1959 Edition of Tyler. I’ve tried really hard to locate the Publishers of Tyler’s “A Laboratory Manual of Physics” to sort out copyright, but no one is owning up to this. Edward Arnold was taken over and is now part of the Hodder Education Group. I contacted them and they’ve no record of this book.
A scan of the HEAT Experiments from the 1959 Edition of Tyler. I’ve tried really hard to locate the Publishers of Tyler’s “A Laboratory Manual of Physics” to sort out copyright, but no one is owning up to this. Edward Arnold was taken over and is now part of the Hodder Education Group. I contacted them and they’ve no record of this book.
A scan of the LIGHT I Experiments from the 1959 Edition of Tyler. I’ve tried really hard to locate the Publishers of Tyler’s “A Laboratory Manual of Physics” to sort out copyright, but no one is owning up to this. Edward Arnold was taken over and is now part of the Hodder Education Group. I contacted them and they’ve no record of this book.
A scan of the LIGHT II Experiments from the 1959 Edition of Tyler. I’ve tried really hard to locate the Publishers of Tyler’s “A Laboratory Manual of Physics” to sort out copyright, but no one is owning up to this. Edward Arnold was taken over and is now part of the Hodder Education Group. I contacted them and they’ve no record of this book.
A scan of the SOUND Experiments from the 1959 Edition of Tyler. I’ve tried really hard to locate the Publishers of Tyler’s “A Laboratory Manual of Physics” to sort out copyright, but no one is owning up to this. Edward Arnold was taken over and is now part of the Hodder Education Group. I contacted them and they’ve no record of this book.
A scan of the MAGNETISM Experiments from the 1959 Edition of Tyler. I’ve tried really hard to locate the Publishers of Tyler’s “A Laboratory Manual of Physics” to sort out copyright, but no one is owning up to this. Edward Arnold was taken over and is now part of the Hodder Education Group. I contacted them and they’ve no record of this book.
A scan of the LIGHT II Experiments from the 1959 Edition of Tyler. I’ve tried really hard to locate the Publishers of Tyler’s “A Laboratory Manual of Physics” to sort out copyright, but no one is owning up to this. Edward Arnold was taken over and is now part of the Hodder Education Group. I contacted them and they’ve no record of this book.
Sorry you can no longer download EXCEL to your home machine but some of you might have this.
If you are not familiar with Excel can I recommend you spending a bit of time looking over the post in the BGE section (link below). I’ll add a further advanced part for you below.
If you sign up to Archive you can borrow a copy of Armitage PRACTICAL PHYSICS IN SI, a great book to start with for project ideas (totally based on Tyler), but the derivations are rubbish.
Referencing, a great little document from Queen’s University Belfast which they haven’t got up anymore, so I hope they’re OK that I’ve uploaded it here.
Here are ways to prevent you losing marks for producing the smallest graph when you paste from excel into your project.
How to record your relationships!
This is not a discussion about your friendships but how the data can be described.
The best terminology to use for graphs that have
a trend which is a straight line is ‘a linear relationship’.
That avoids issues around whether something is directly proportional or proportional.
Directly proportional only applies when the graph is a straight line through the origin (or close to the origin within the uncertainty in the y-intercept). It is best to avoid ‘proportional’ altogether.
A curve, such as that produced when plotting irradiance against distance, can never be described as showing an ‘inversely proportional’ relationship, since it does not show the actual relationship (it could potentially be any number of different relationships).
Inverse proportionality can only be claimed when the correct graph of, for example, irradiance against 1/d2 is drawn, and it produces a straight line through the origin.
The type of graph produced for an internal resistance experiment is covered by the term ‘linear relationship’, as it follows the equation y=mx+c format.
Before handing in your project please check
- Do you have a title?
- Do you have a contents page with each section marked and the page numbers given in the contents page?
- Do you have an abstract directly before or after your contents page?
- Does your abstract give your overall aim (and does it fit ALL of your experiments)? If you said you were going to compare your results (best not too) then have you done that comparison?
- Does your abstract name the three experiments, so that it is clear what you did?
- Does your abstract have the conclusion for each of your experiments and do the numbers match what is in your project (check you’ve not transposed the answers incorrectly)?
- Does your U.P. have any history?- if it does remove it!
- Does your U.P. have equations and derivations? Are the quantities defined in each of your equations with their corresponding SI unit?
- Is your U.P. at AH level and relevant to what you actually did?
- Is your procedure in the past tense impersonal i.e no I did this or the apparatus is! having the present tense will automatically lose you a mark or stop you accessing the second one.
- Does your procedure give the range of your measurements, the number of repeats and the intervals of measurements? If not go back and add them in.
- Are your diagrams at least 1/2 page and labelled with no clutter in the background? You can always hand draw your diagrams, with a ruler and label them then either scan them in or add in the pages, but don’t forget to add a blank page in your project so the numbers match up
- Do all of your table have the correct measurements, units and are these actually what you measured? Don’t only put radius in your table if you measured the diameter, add in the diameter and then show you halving it to find R. Remember the units of T2 are s2 . Missing headings, not showing raw data, not showing what you measured rather than what you derived will cause you to lose this mark.
- Do you have at least 2 graphs which are over half a page (better still make them a whole page), use crosses not dots and have the minor gridlines added in. What looks good on the screen doesn’t print out clearly so change the gridlines to slightly darker. It is nice to have the tickmarks from the axis outside to make them clear. If using google sheets (try not to), then check the number of minor gridlines to major gridlines, google likes 3 and 6 (worst scale ever).
- Do your graphs have the data up the right way with the correct axes labels with units?
- Have you made your trendline 0.5-0.75pt thick and have you changed the dash line for a solid line
- Are your crosses 0.4 or 0.5 pt only? (no fill and solid border)
- Do you have a sample calculation to show how you calculate, mean, approximate random uncertainties, linest, derived measurements?
- To get linest you write
- =LINEST(then type in the range for the y axis (comma) then type in the range for the y axis (comma) 1,1) eg =LINEST(A3:A7,L3:L7,1,1)
- To find the approximate random uncertainty type in
- =(max(range)-min(range))/counta(range)
- To find the mean type in
- =average(range)
- To combine uncertainties type in
- =sqrt((cell name^2)+(cell name^2)+(cell name^2)) etc
- Make sure your averages have the same sig fig as your data
- eg 1 means somewhere between 0.5- 1.4
- 1.0 means somewhere between 0.95-1.04
- 1.00 means somewhere between 0.995-1.004 (so what did YOU mean?)
- To get linest you write
- Have you got a box with at least 4 of the LINEST functions in? Does it match your gradient on the graph?
- Have you added in your scale reading uncertainty, your approximate random uncertainty and your calibration uncertainty for every one of your measurements? If you can’t find a calibration uncertainty use the appendix in Normal Fancey and Gemmell Millars booklet in the Uncertainties section. If your equipment is old it is likely to have a larger calibration uncertainty. A good rule of thumb is 0.5% of the reading + the smallest digit it can measure.
- Have you worked through your readings and checked that everything was in standard units and that you got the expected value?
- Does your evaluation start with your measured value or trend and that expected. Have you commented on the size of the uncertainties and if the uncertainty includes the expected value?
- Does the evaluation for each of your experiments cover
- accuracy and precision of experimental measurements
- adequacy of repeated readings
- adequacy of range over which variables are altered
- adequacy of control of variables
- limitations of equipment
- reliability of methods
- sources of uncertainties?
- Do you have an overall evaluation covering the following points?
- comment on:
- selection of procedures
- problems encountered during planning
- modifications to planned procedures
- interpretation and significance of findings
- suggestions for further improvements to procedures
- suggestions for further work
- Do you have at least three references and have you used a reference generator to ensure that they are in Harvard or Vancouver style? Do you have a number box in your report where you use this reference (Vancouver) or author and year (Harvard)?
- Does your references have
- author
- title of the webpage,
- full url
- date of access
- book pages, edition, where printed etc?
- To be acceptable:
- — Internet sources must be referenced by as many of the following as possible: author(s) (year), article title, website title, full URL, date of access.
- — Book sources must be referenced by as many of the following as possible: author(s) or editor(s), title of book, edition number (if other than first edition), place (city) of publication, publisher’s name, year of publication, page numbers.
- — Journal sources must be referenced by as many of the following as possible: author(s), year of publication, title of journal article, title of journal, volume number, issue number, page numbers of the article.
- Are all of your pages numbered (even by hand)? It is useful to choose a page numbering system that has page X of Y, so that the marker can check they are all there.
- If your project has taken 10-15 hours of practical work and you’ve gone through and followed this plan you shouldn’t get less than about 11 marks, you’d be surprised how many don’t!
- PS Don’t generate your data by AI, this is cheating.
- Is your word count under 4900 words for everything except calculations, tables, references? If you don’t know what your word count is COPY YOUR PROJECT AND NAME THE COPY WORD COUNT– THIS IS IMPORTANT SO YOU DON’T LOSE YOUR WRITE UP. REMOVE ALL THE SECTIONS THAT DON’T COUNT AND THEN DO A WORD COUNT. IF YOU DON’T SAVE IT BETWEEN RENAMING IT AND DOING THE COUNT AFTER REMOVING ALL THE IRRELEVANT STUFF YOU MIGHT BE ABLE TO RECOVER IT. IT MIGHT BE AN IDEA TO EMAIL YOU AND YOUR TEACHER A COPY OF YOUR FINAL PROJECT BEFORE DOING THIS STAGE.
- BEST OF LUCK


